Has OT Been Compromised? (Look to the Network)

🌐✨
Part 2: Look to the Network
When answering the question of “Has OT been compromised?”, I believe that the heart of this solution lies in the unassuming yet powerful realm of network data, a treasure trove of insights without the interrogation of OT assets. I want to present the pivotal role that network data plays in idenitfying the occurrence of incidents within OT environments. By harnessing the wealth of information flowing through network channels and communications between systems, we can detect anomalies and breaches but also understand their nature and scope with remarkable clarity. This exploration aims to unveil how network data, when meticulously analyzed, becomes an indispensable ally in the quest for robust OT incident response, ensuring operational continuity and safeguarding critical infrastructure.
I have found that these network-level indicators can help to signify the potential occurance of a full out cybersecurity incident:
Unauthorized network scans: Port scans, service interrogations, vulnerability scans, and more are all indicators or malicious activity and could indicate a compromised network. These activities can mean that the adversary has gained a foothold into OT and is looking for opportunities to move lateral to other systems….they are also very visible in a pcap or trace file if caught in the act.
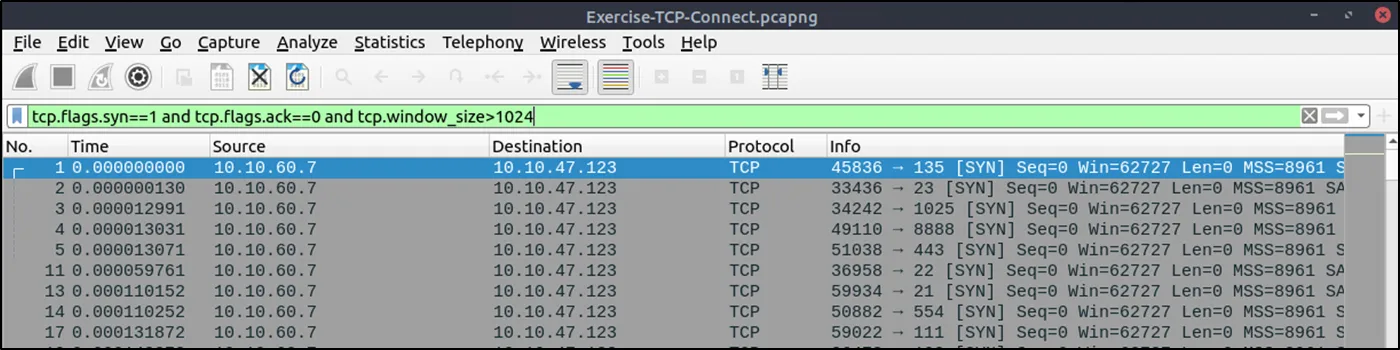
Tools like Network Miner, Brim (Zui), Zeek, TShark, and Wireshark can quickly identify port scanning activity if the activity is caught during the time of a network packet capture. This is a Wireshark example of port scanning activity in Wireshark, specifically a SYN scan (half-open scan) where the 10.10.60.7 host is scanning for common ports like SSH (tcp/22) and MySQl (tcp/3306) on the 10.10.47.123 host:
Multiple failed login attempts: Repeated failed login attempts to access network resources and applications could indicate brute force attacks against OT systems. Depending on the network protocol, these failed logins can also be seen pcaps from FTP, telnet, or other similar protocols common to OT environments.
Additionally, when the syslog protocol is enabled within an OT network by switches, routers, PLCs, RTUs, IEDs, it can serve as a critical tool in the identification of malicious activity, particularly unauthorized or strangelogins. By analyzing these logs, you can spot irregular patterns and anomalies that could indicate malicious attempts to access systems. Key indicators such as repeated login failures, login attempts at unusual hours, or logins from unexpected locations are telltale signs of potential intrusions.
Here’s a example and description of a syslog output:
1
2
Jul 10 08:23:14 server1 sshd[17345]: Accepted password for user1 from 192.168.1.25 port 54022 ssh2
Jul 10 08:23:14 server1 sshd[17345]: pam_unix(sshd:session): session opened for user user1 by (uid=0)
In this example:
Jul 10 08:23:14: This is the timestamp indicating the date and time when the login attempt occurred.
server1: The name of the server where the login attempt was made.
sshd[17345]: This shows the service (SSH daemon, sshd) and the process ID (17345) handling the login request.
Accepted password for user1: Indicates that the login was successful for the username ‘user1’.
Note: from 192.168.1.25 port 54022 ssh2: Shows the source IP address (192.168.1.25) and the port number (54022) from which the login attempt was made, along with the protocol used (ssh2).
pam_unix(sshd:session): Refers to the Pluggable Authentication Module (PAM) indicating the opening of a new session.
session opened for user user1 by (uid=0): Indicates that a session was opened for ‘user1’. The ‘uid=0’ part typically refers to actions performed by the root user, which in this case, is handling the session opening.
3.Unusual outbound traffic indicators: Large or unexpected data transfers, especially to foreign or unknown IP addresses, could indicate data exfiltration activity. In OT, this could be especially egregious due to government and regulatory body incident reporting requirements and potential fines.
There are are a wide range of tools to give visibility into large or unexpected data transfers within your network. Tshark is a great tool that can give help you understand your network traffic. Here’s an example of a Tshark command that read a pcap and outputs relevant fields for you to understand data transfer sizes between network hosts. With Tshark on a installed, this command can be ran within most unix-based terminals and it even outputs the result to a csv file:
1
tshark -r yourfile.pcap -T fields -e ip.src -e ip.dst -e tcp.srcport -e tcp.dstport -e frame.len -E header=y -E separator=, -E quote=d -E occurrence=f > result.txt
In this command:
-r yourfile.pcap: Specifies the pcap file to read from (yourfile.pcap should be replaced with your actual file name).
-T fields: Sets the output format to custom fields.
-e ip.src: Extracts the source IP address.
-e ip.dst: Extracts the destination IP address.
-e tcp.srcport: Extracts the source port (for TCP traffic).
-e tcp.dstport: Extracts the destination port (for TCP traffic).
-e frame.len: Extracts the length of each frame, which can be useful for understanding the size of packets.
-E header=y: Includes a header row in the output.
E separator=,: Sets the field separator to a comma (useful for CSV format).
-E quote=d: Ensures fields are enclosed in double quotes.
-E occurrence=f: Specifies that only the first occurrence of each field should be printed.
This is what the example output would look like in a terminal:
1
2
3
4
5
6
7
8
9
10
"ip.src","ip.dst","tcp.srcport","tcp.dstport","frame.len"

"192.168.1.10","203.0.113.5","49152","80","60"

"203.0.113.5","192.168.1.10","80","49152","60"

"192.168.1.10","203.0.113.5","49152","80","1500"

"203.0.113.5","192.168.1.10","80","49152","1500"
...
This is an example of what the CSV file output:
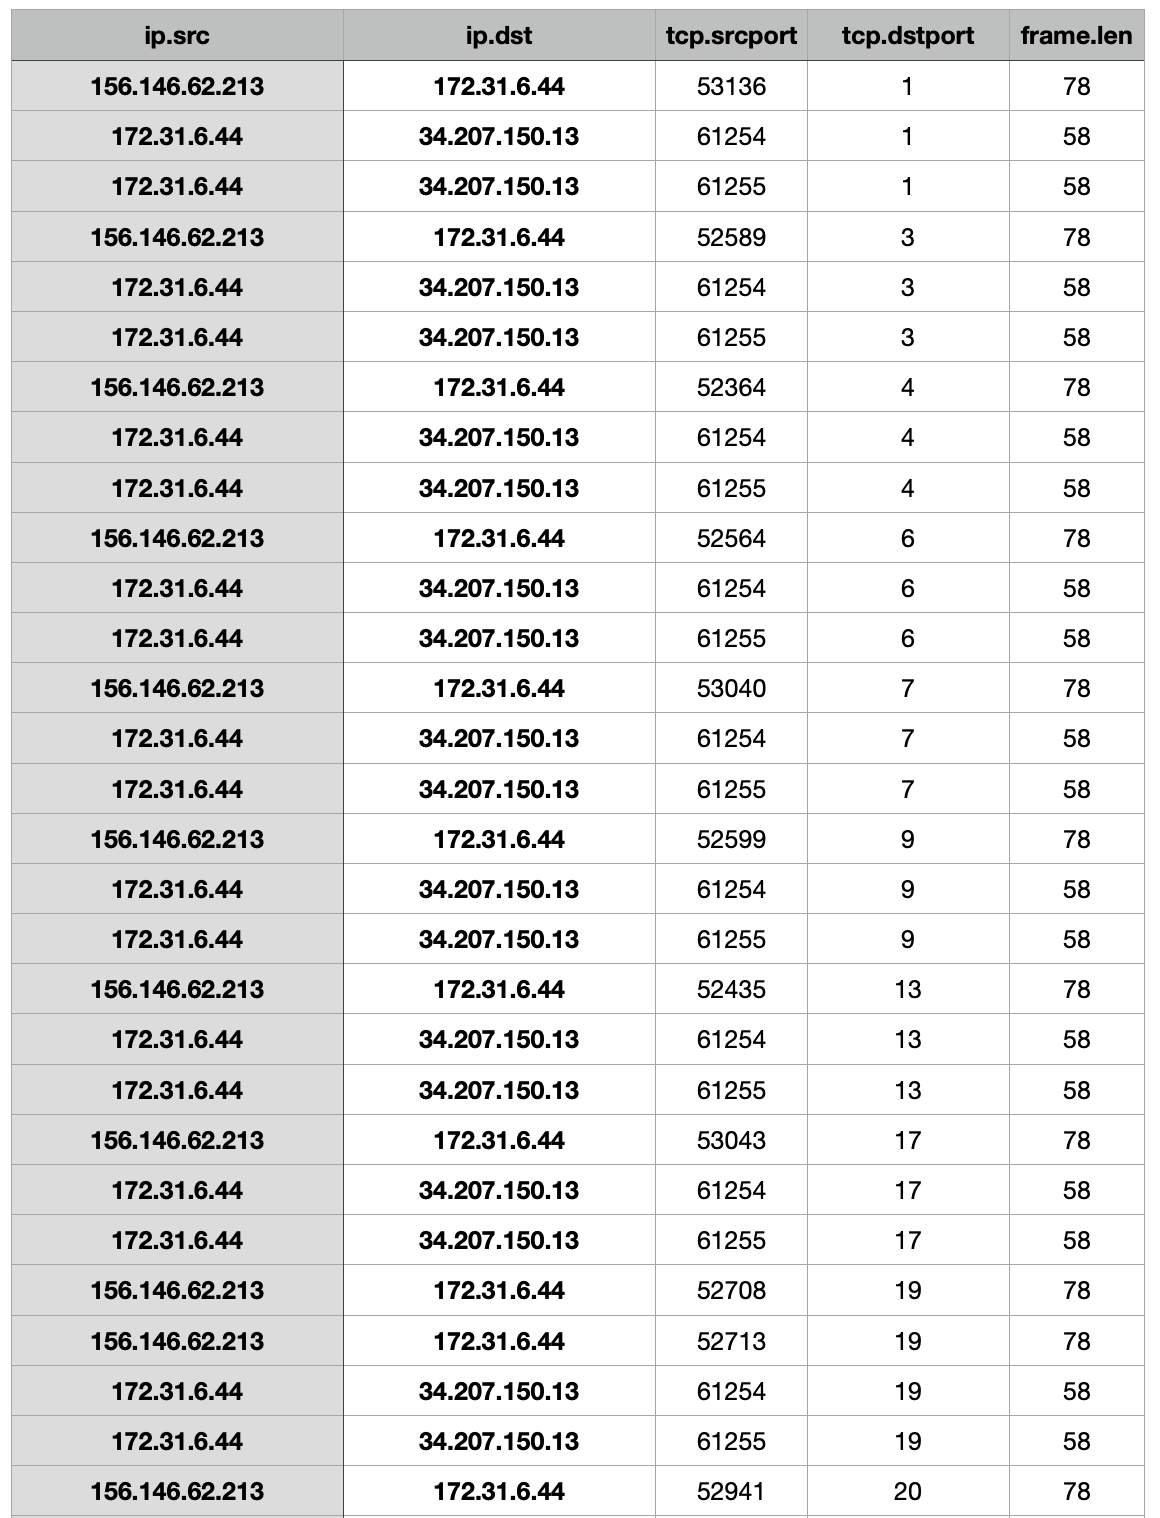
Note: TShark doesn’t have a field for bits transferred between hosts so I added a column called
Bitswhich multiplies theframe.lenby 8 to calculate the total bits value.
4.Unexpected geographical locations: Logins or traffic originating from or going to geographic locations that are unusual for organizations can be a strong indicator of suspicious and malicious network activity in OT. Because OT networks are typically static in nature, unusual geographical data on teh network would bubble to the top during an investigation. This includes regions not typically associated with the company’s operations or outside its usual business network (i.e. China, Russia, and North Korea). Such anomalies in geolocation data can signal potential cybersecurity threats, like targeted attacks from foreign entities or compromised internal systems being accessed from abroad.
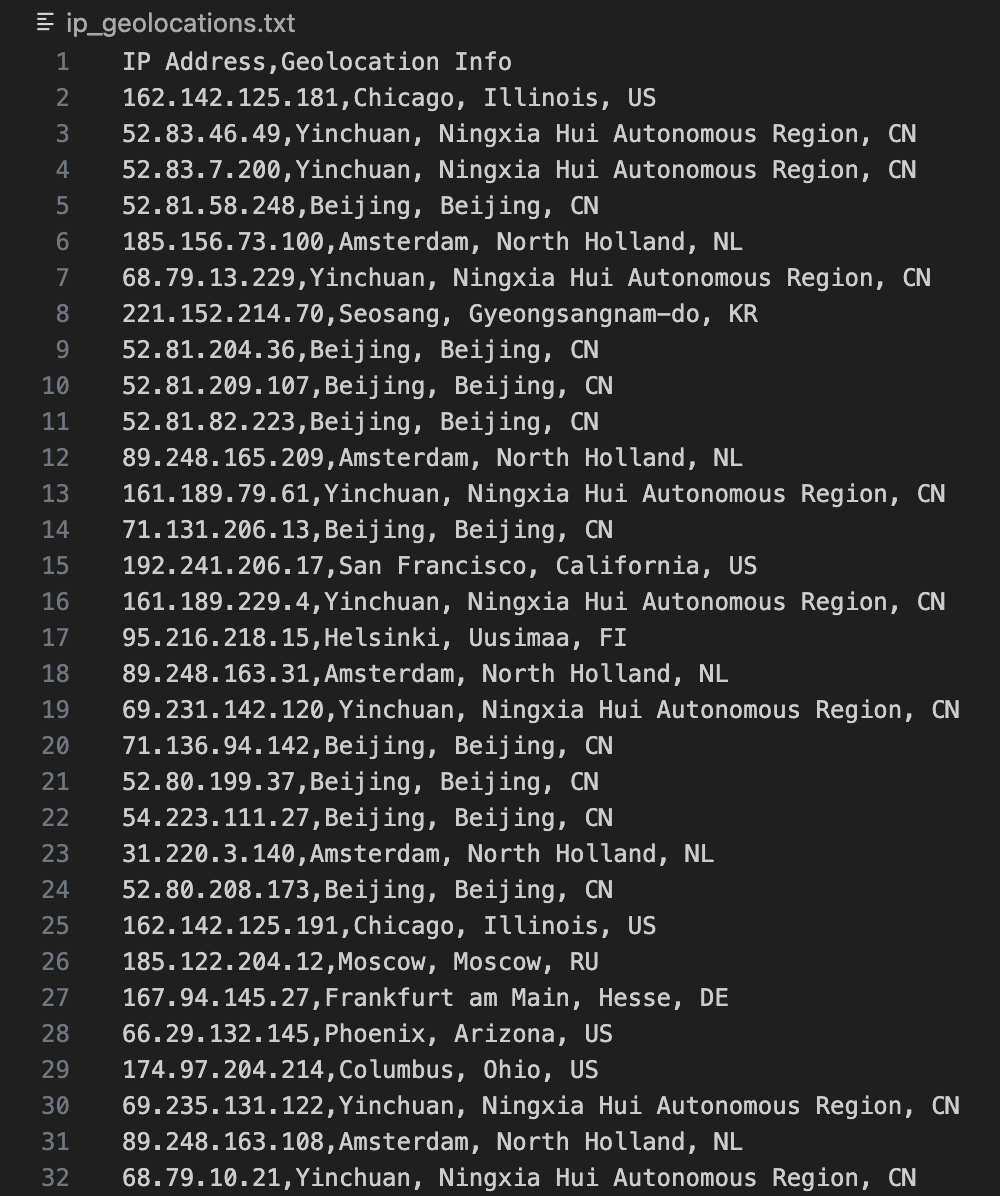
Many security tools have the ability to extract this info from network data but for a quick and dirty method of detecting what your network traffic is tellig you about geolocation information, I created a Python script on my GitHub page called pcap_to_geolocation. It is designed to parse pcap files and extract geolocation information related to the source and destination of network traffic. By converting raw network data into actionable geolocation insights, this tool can enhance your ability to identify and investigate potential security breaches that manifest through unusual geographic patterns in network traffic.
It’s just raw code at the moment but you can find more about this project and its functionalities at pcap_to_geolocation on GitHub.
This is an example of the output from the script:
Note: While geolocation analysis can be a valuable tool in identifying potential security threats, it is important to note that it is not an infallible indicator of malicious activity. The increasing use of VPNs and other geo-obfuscation techniques can significantly skew the perceived location of network traffic. These technologies allow legitimate users to appear as if they are accessing systems from different geographical locations, often for privacy or access reasons. Similarly, attackers can employ these methods to mask their true location, making it appear as though their activities are originating from benign or unrelated regions. Therefore, while unexpected geolocation data can raise red flags, it should be considered alongside other indicators and contextual information to accurately assess the nature of the network activity.
Summary
As we’ve delved into the complexities of network data in OT environments, the importance of this domain in identifying and thwarting cyber threats is unmistakable. The indicators we’ve uncovered - unauthorized network scans, failed login attempts, unusual outbound traffic, and unexpected geographical locations - are vital navigational aids in the treacherous waters of operational technology cybersecurity.
This exploration, however, is just the beginning. The cyber landscape is constantly evolving, presenting new challenges and threats. Staying informed and equipped with the right tools and knowledge is our best defense.
Keep an eye on this blog for more insights and strategies to protect our critical OT infrastructures. Your participation and insights are crucial in this ongoing battle against cyber threats. Let’s continue to learn, adapt, and stay vigilant together.
Thank you for joining this journey. Until next time, stay informed and stay secure! 🌐✨